
Germany Deutschland
Solar and energy profile
- Codes
- DEU · M49 276
- Currency
- Euro (EUR)
- Exchange rate
- 1 USD = 0.8874 EUR 2026-10-06, ECB
- Exchange rate
- 1 EUR = 1.1269 USD 2026-10-06, ECB
- Annual inflation
- 2.9 % 2026-08, OECD
Energy
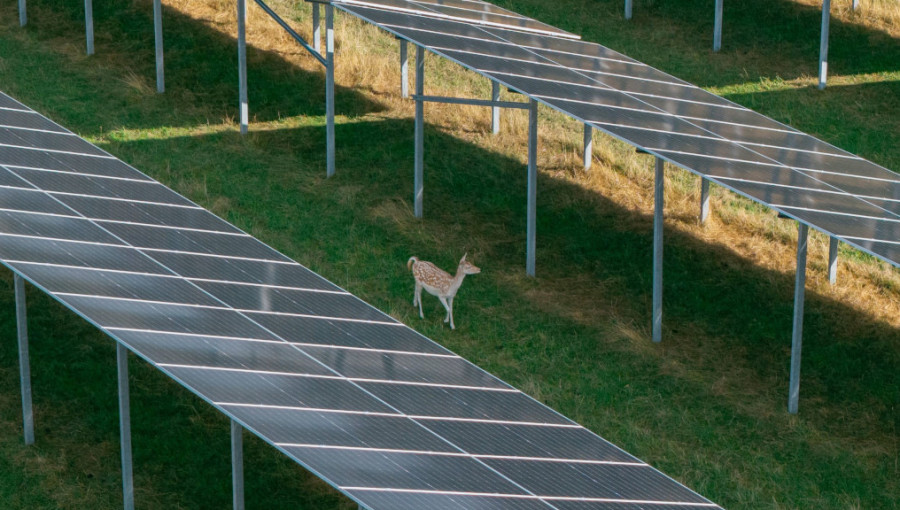
- Installed solar
- 107.2 GW
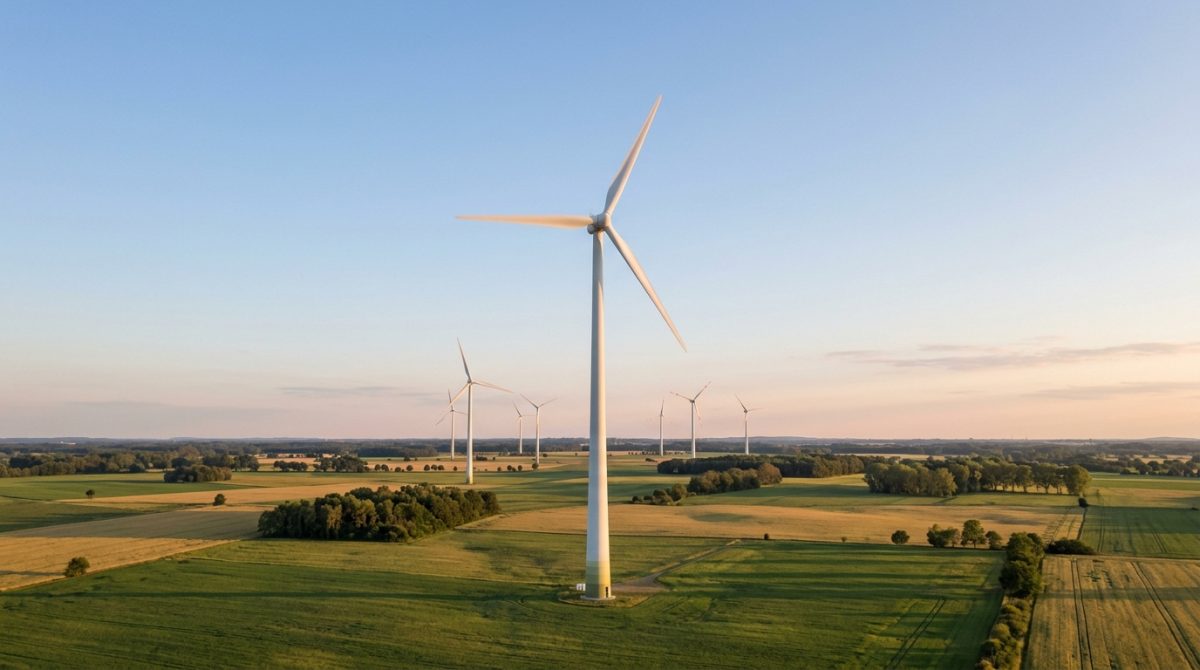
- Installed wind
- 77.9 GW
- Installed geothermal
- 78 MW
- Battery storage
- 21.5 GW
- Electricity demand
- 516.5 TWh
- Solar generation
- 89.7 TWh
- Solar share of generation
- 18.0 %
Country data
- Population
- 83.5 million
- Solar potential (PVOUT)
- 2.96 kWh/kWp a day
Germany news
All 89 stories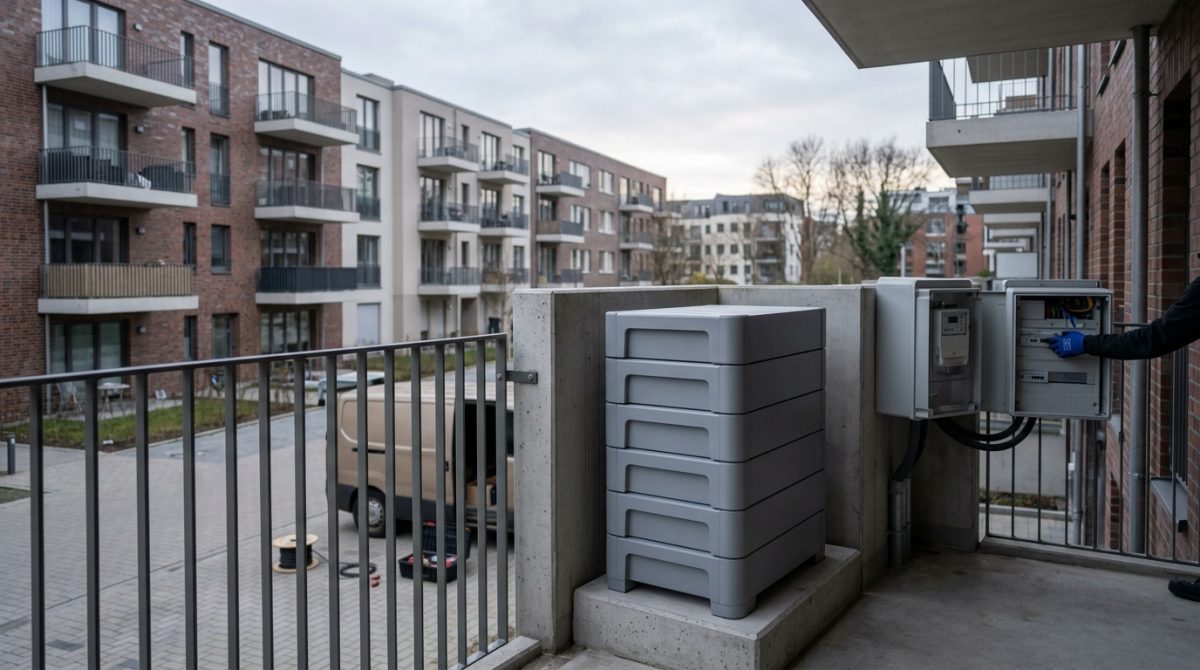


Sources
- European Central Bank (opens in a new tab) : Source: European Central Bank, euro reference rates. Rates against the US dollar are cross rates calculated from the ECB euro reference rates.
- Ember (opens in a new tab) : Source: Ember, Yearly electricity data, licensed under CC BY 4.0. Demand is generation plus net imports.
- Energy-Charts (opens in a new tab) : Source: Energy-Charts.info (Fraunhofer ISE), based on the German market master data register, licensed under CC BY 4.0.
- World Bank, ESMAP and Solargis (opens in a new tab) : Source: World Bank and ESMAP, Global Photovoltaic Power Potential by Country (Solargis, 2020), licensed under CC BY 4.0. The yearly figure is the daily average times 365.
- IRENA (opens in a new tab) : © IRENA. Source: IRENA, Renewable Energy Statistics (IRENASTAT), International Renewable Energy Agency, Abu Dhabi.
- OECD (opens in a new tab) : Source: OECD, Consumer price indices (national CPI, all items, change over one year), licensed under CC BY 4.0.
- World Bank (opens in a new tab) : Source: The World Bank: World Development Indicators: Population, total (SP.POP.TOTL), licensed under CC BY 4.0.
Figures are fetched from their sources automatically; a large change, and every figure found on a publisher's page, waits for an editor's check before it appears. Last checked 2026-10-07. About our sources